Sales Performance Metrics That Reveal Competitive Loss Risk
Early warning signs of competitive loss hide in metrics you're already tracking.

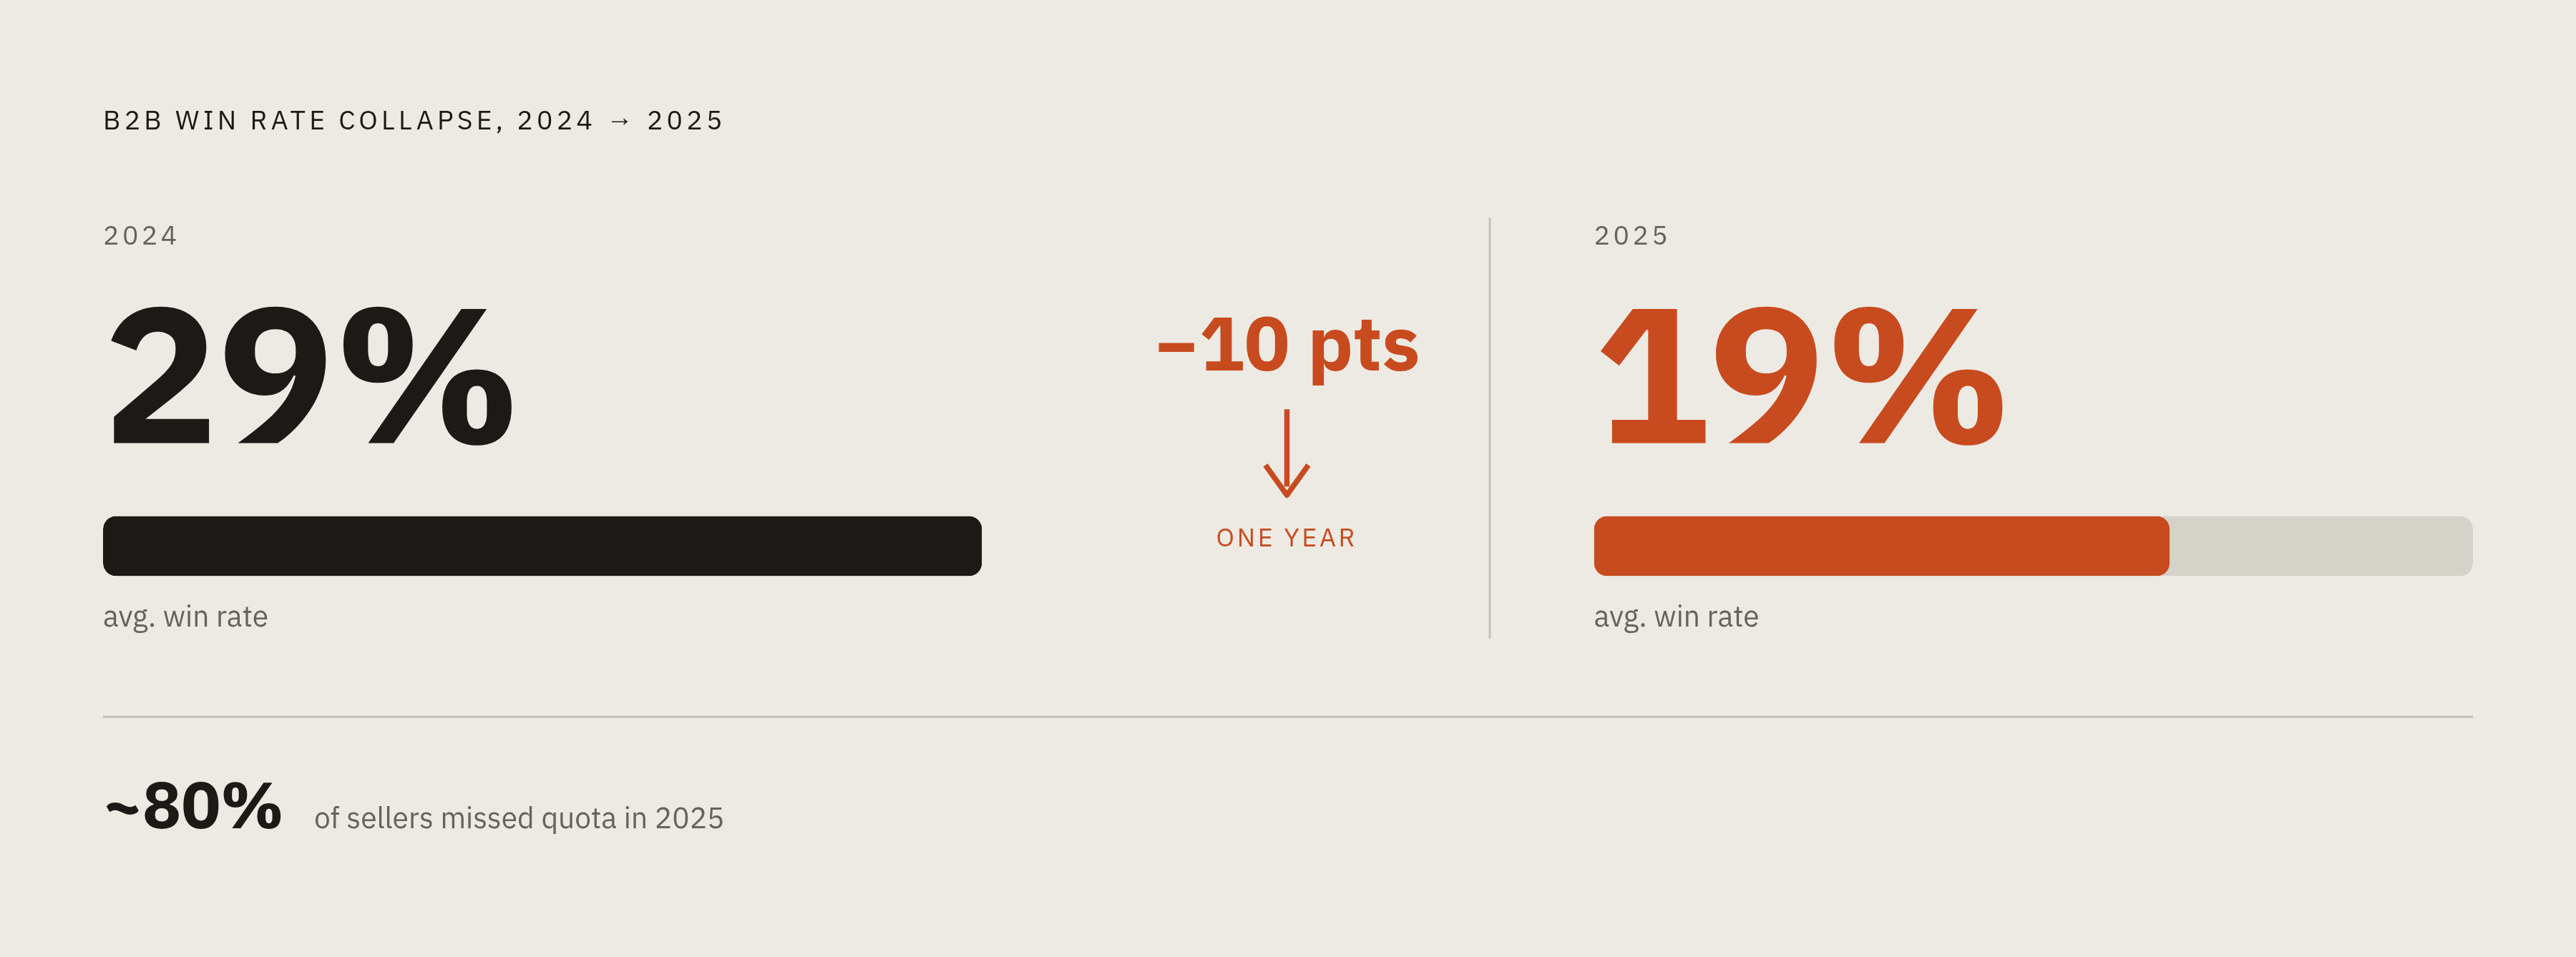
If your win rate is falling and your reps can't tell you why, the answer is probably already sitting in the metrics you're already tracking. You're just not reading them as competitive signals. Win rates across B2B sales averaged 19% in 2025, down from 29% the year before. That's not a bad quarter. That's a structural collapse — like watching a house slowly sink into the ground and calling it "settling." Nearly 80% of sellers missed quota that same year, and revenue per seller dropped by double digits. Meanwhile, buyers are completing roughly 60% of their evaluation before a rep even enters the picture, and the vast majority of buying groups have already ranked their preferred vendors before making first contact. By the time your seller says "I think this one's heating up," the buyer has already made their decision. The good news is that competitive losses don't appear out of nowhere. They leave tracks. The metrics your team is already pulling contain early warning signals for competitive drift. Most teams just aren't reading them that way. This article walks through exactly which metrics surface that risk, what each one is actually telling you, and how to act on them before the deal is gone.
Telling Competitive Losses Apart From Other Kinds Before You Do Anything Else
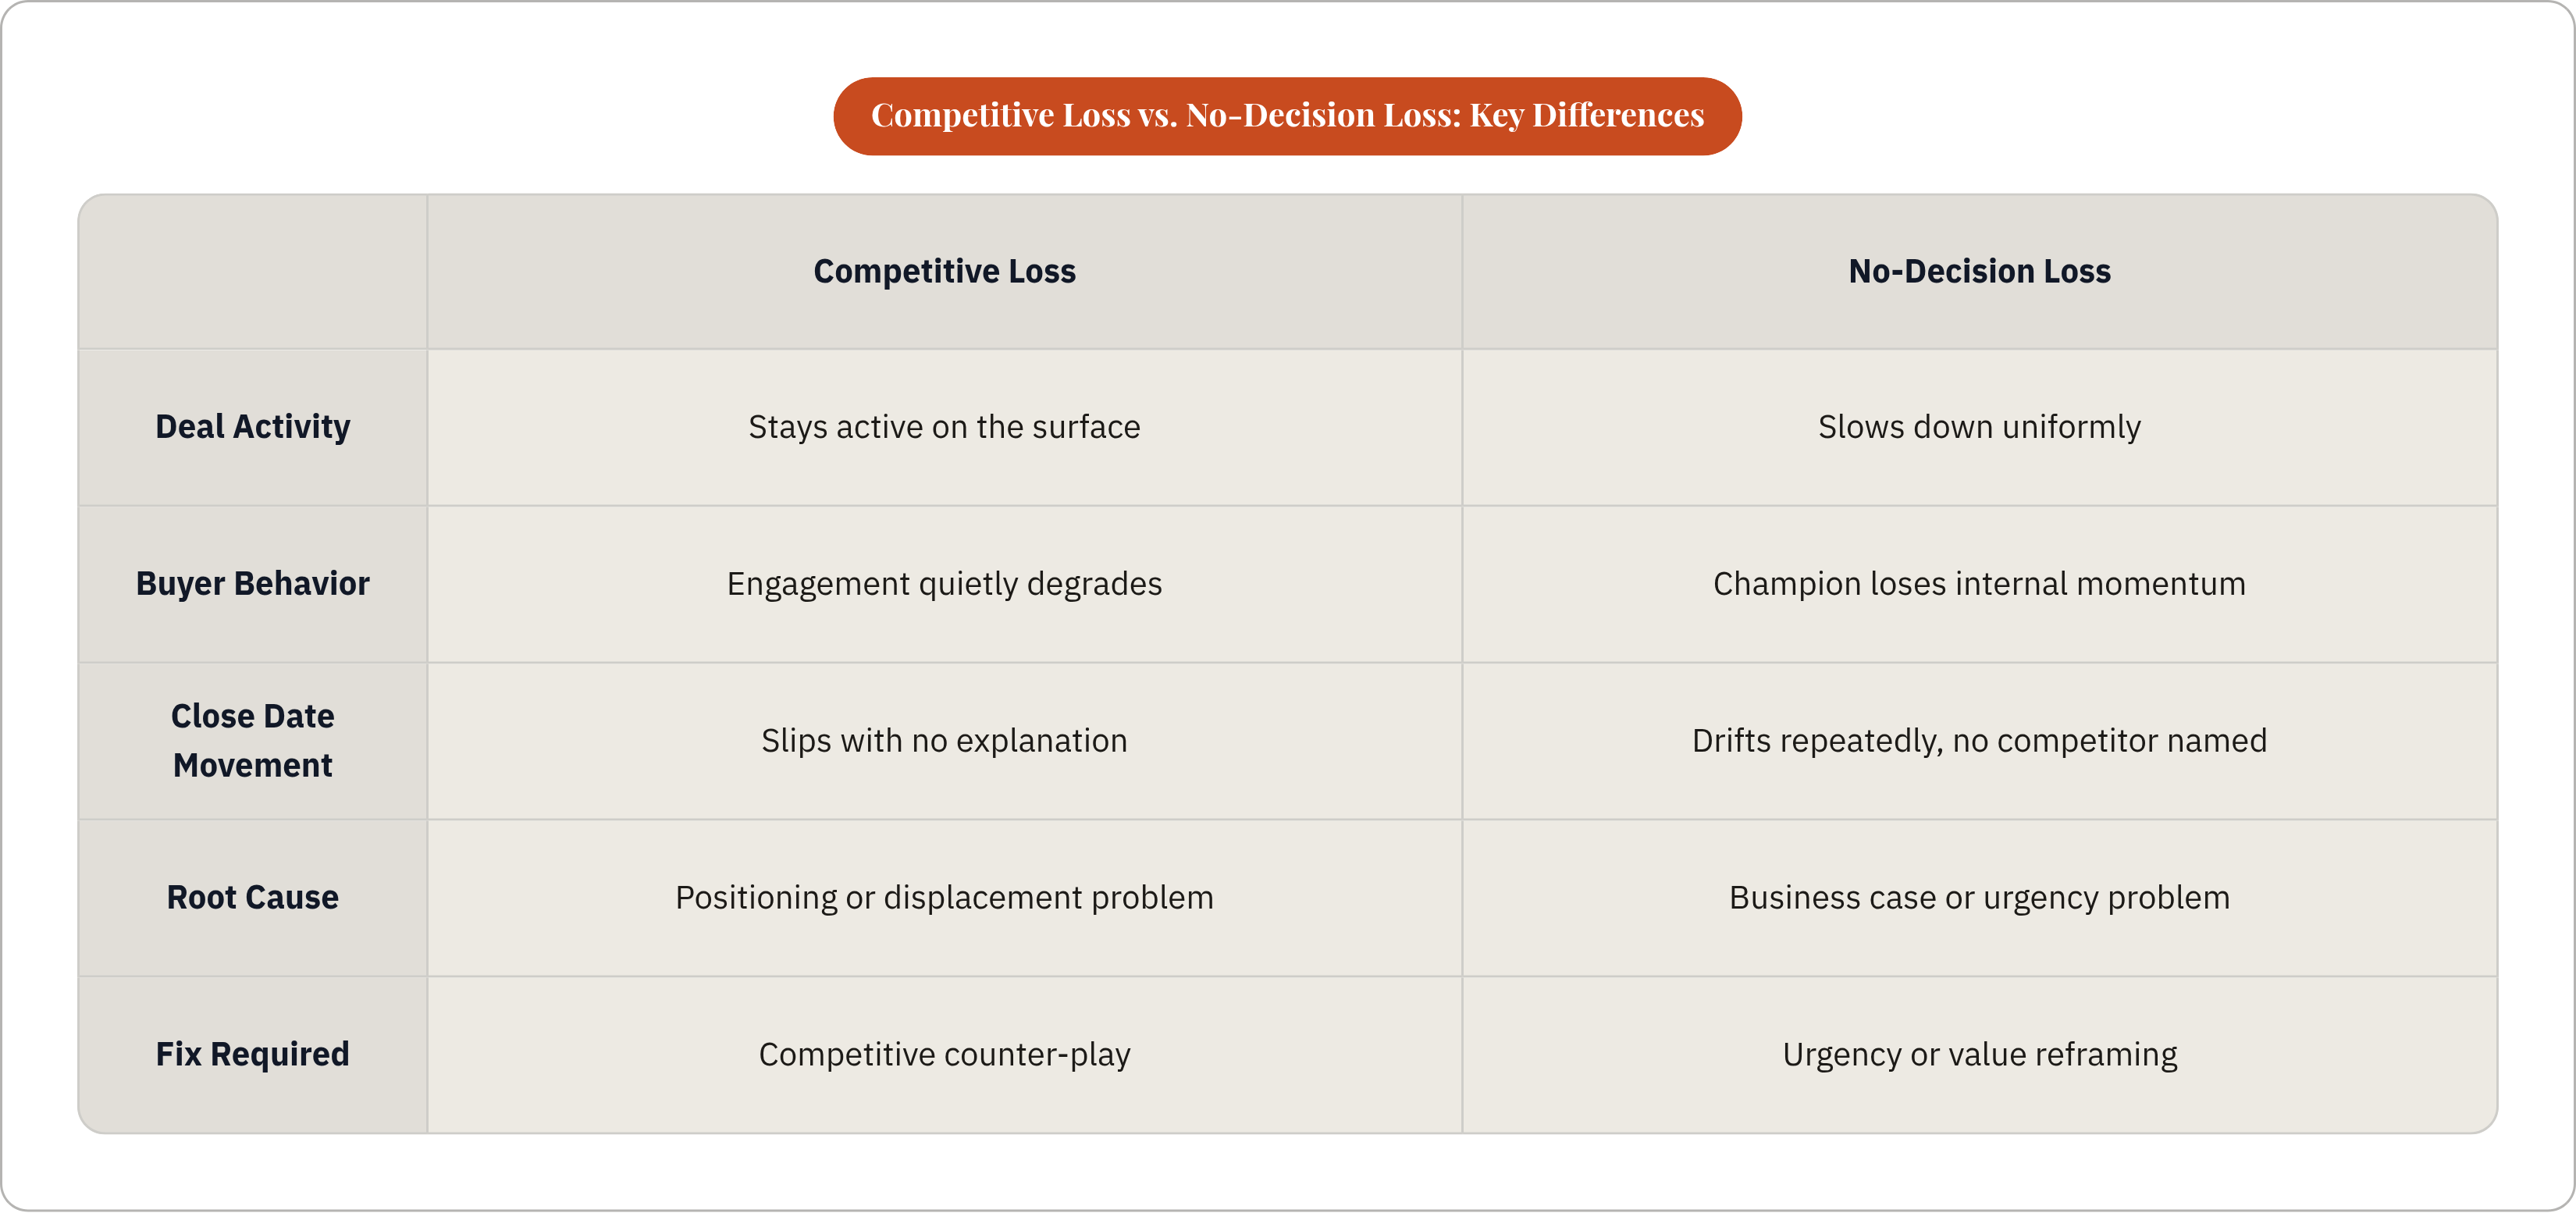
Here's something that gets skipped constantly: a 25% win rate where most of your losses go to one named competitor is a completely different problem from a 25% win rate dominated by no-decisions. Same number. Entirely different fix. If you diagnose one as the other, every intervention you run will miss.
Competitive losses have a specific fingerprint. The deal stays active. The buyer keeps responding. But the quality of the engagement quietly degrades. Questions get shallower. The champion starts going quiet. Meetings get rescheduled more than once. The deal looks alive on the surface while the buyer is mentally somewhere else.
No-decision losses look different. The deal slows down uniformly. The champion loses internal momentum. Close dates drift repeatedly but no competitor's name ever surfaces. That's a business case problem or an urgency problem, not a positioning problem.
The distinction matters before you touch any of the metrics below, because the signals for competitive drift are different from the signals for deal stall. If your team collapses everything into a generic "closed-lost" bucket, none of this works. You need "lost to competitor" as a clean, distinct category in your CRM. Not optional. That's the foundation.
One more thing worth knowing: the vast majority of B2B buyers report a purchase stalled in the past year. Stalled deals and lost deals look almost identical inside a CRM. The metrics in this article help you tell them apart while you still have time to do something about it.
What Stage Conversion Rates Are Actually Telling You About Where the Problem Lives
Stage conversion rate is simple. It's the percentage of deals that move from one pipeline stage to the next. A drop anywhere in the funnel is a signal. But where the drop happens tells you what kind of signal you're looking at.
An early-stage conversion drop usually means your ICP targeting is off, or a competitor is capturing attention before your rep has a chance to establish value. The deal enters the funnel, but the buyer's mind is already elsewhere.
Late-stage conversion drops are the more dangerous competitive signal. The buyer has been engaged. A proposal is out. And then progression stops. That's often the moment a competitor made their move.
The important distinction: consistent drop-offs after the proposal stage can indicate pricing or process friction. But when those drop-offs cluster in deals where a named competitor is present, the signal changes meaning entirely.
The practical move here is simple:
- Segment your stage conversion rates by competitive deals vs. non-competitive deals
- If a large gap exists between those two groups, you have a competitive leak at a specific stage
- That is not a general conversion problem. It's a targeted one.
What stage conversion doesn't tell you is why deals are dying at that stage. It tells you where. The next few metrics fill in the behavioral detail.
What a Lengthening Sales Cycle Is Actually Telling You About a Buyer's Attention
The average B2B sales cycle stretched to 6.5 months in 2025. That's the baseline. Any deal running significantly longer than what's normal for your segment is worth flagging, not writing off as "still in progress."
When a deal that should close in 60 days is sitting at 90 with no clear internal explanation, one very common reason is buyer distraction. They're running a parallel evaluation your rep doesn't know about.
The specific pattern to watch isn't cycle length alone. It's close date movement without a stated reason. A close date that slips because of a new stakeholder or a budget cycle is understandable. A close date that moves twice with no explanation is a different thing entirely. Once is a warning. Twice means the deal is already inside a competitive evaluation the buyer just hasn't told you about.
There's a timing problem baked into all of this. Research shows that proactive outreach to an account eight months before a renewal lands well. The same outreach one month before the renewal often arrives after the decision has already been made. Cycle elongation in active deals is the analog to that timing problem. The longer a deal sits without forward movement, the further behind the intervention curve your team gets.
How Engagement Depth Separates Buyers Who Are Drifting From Buyers Who Are Deciding
Engagement is not the same as responsiveness. A buyer who answers emails but gives shorter and shallower answers each time is not an engaged buyer. That distinction is what engagement depth is about.
A few things to track here:
Buying committee breadth. Three people from the same company showing moderate engagement is more predictive of a real opportunity than one person showing strong solo interest. Committee formation is a positive signal. Committee silence is a warning sign.
Champion behavior. When a previously active champion starts responding less often, sends shorter replies, or stops initiating contact, that's a red flag. They have lost internal support. Or they have shifted toward a competitor and are managing the exit.
Content engagement. Buyers who are still actively evaluating consume content. Buyers who have mentally moved elsewhere stop engaging entirely. Tracking which prospects are reading comparison content, pricing pages, or competitor-adjacent material gives you behavioral confirmation of where they actually are.
Accounts that show up on review platforms like G2 comparing vendors convert at more than twice the rate of accounts without those signals. The inverse is just as important. A buyer who was actively comparing options on a platform like that and has now gone completely quiet has already made a call.
The structural vulnerability here is the single-threaded deal. One contact, shallow email exchanges, no breadth across the buying committee. That deal is exposed. Multi-threaded deals with real engagement across multiple stakeholders are harder to displace. When engagement drops below a meaningful threshold in a deal past mid-cycle, that's when a risk flag should trigger.
What Competitive Win Rate Tells You That Overall Win Rate Deliberately Hides
An overall win rate of 19% is alarming. It's also blunt. It doesn't tell you how many of those losses went to a competitor versus how many deals just never converted at all. Those are different problems.
Competitive win rate is what you get when you segment win rate specifically for deals where a named competitor was present. That's the number that surfaces a positioning problem. Overall win rate can obscure it completely.
A few layers worth adding:
Deal size matters. Win rates for smaller contracts tend to run significantly higher than win rates for large enterprise deals. If your competitive win rate is dramatically below the average for your segment at a specific deal size, you have a positioning breakdown that's concentrated at a price point. That's a solvable problem. A general loss problem is harder to solve.
Competitor-specific breakdowns matter more. If the majority of your competitive losses are going to one named vendor, that's a displacement problem with a specific counter-play. If losses are spread across many competitors evenly, the issue is category credibility, not one vendor's positioning.
The revenue math is worth doing explicitly. If you have significant pipeline at a 20% win rate, every two-point improvement in competitive win rate adds meaningful dollars per quarter. Put it in those terms and it stops being a sales ops metric and starts being a board-level conversation.
97% of companies that invest in formal win-loss programs plan to maintain or increase that investment. The signal is clear. The tracking compounds over time.
The one limitation to be honest about: competitive win rate is a lagging indicator. It confirms a problem that already happened. The behavioral metrics above are what catch the problem while the deal is still live.
How Competitor Intent Signals Surface Risk in Accounts That Haven't Even Entered Your Pipeline
By the time a buyer enters your pipeline, they've already consumed a significant amount of content, reviewed multiple vendors, and started forming a competitive ranking. That process happens before your rep knows the evaluation exists.
Intent signals are how you see the evaluation starting before you're invited to it.
There are three tiers, and they're not equal:
- First-party signals. Website visits, content engagement, direct interaction with your owned properties. Highest signal quality. Lowest volume.
- Third-party signals. Review site activity, topic research, content consumption patterns across thousands of B2B sites. Broader coverage, but requires filtering to be useful.
- Contextual signals. Job postings, leadership changes, language in earnings calls. The least saturated channel because most teams don't systematically track them.
Platforms that aggregate topic-level consumption data can flag accounts that have never visited your website but are showing a spike in research activity on relevant topics. That's the practical value. You're surfacing accounts that are in-market before they've raised their hand.
Here's the honest problem with intent data: the market is massive and growing fast, but only a fraction of B2B teams report getting exceptional ROI from it. The majority of organizations report that the signals are unreliable or inflated at some level. The data is widely purchased and poorly acted on. The edge isn't in buying more feeds. It's in how you filter, prioritize, and respond to what you have.
When competitor install data, intent spikes, and contract end dates converge on the same account at the same time, the intervention window is defined. That's the moment proactive outreach works. The problem is almost always the same: the signal surfaces in a feed, no one has an SLA for it, there's no routing logic, and there's no suggested talk track. The tool isn't the bottleneck. The process is.
What Late-Stage Deal Drop-Off Tells You That Every Earlier Metric Missed
Late-stage drop-off is when deals reach the proposal, negotiation, or verbal commitment stage and then stall or die. It's the most expensive kind of loss. A lot of sales time goes into a deal that was already decided against you.
What makes this a distinct diagnostic is that the earlier metrics flag drift. Late-stage drop-off confirms displacement has already happened. The buyer made a decision and just didn't tell you directly.
The behavioral pattern leading into a late-stage loss tends to follow a recognizable arc:
- Proposal goes out. Follow-up responses get shorter and start coming from a lower-level contact instead of the champion.
- The champion frames every next step as dependent on an internal approval that keeps getting pushed.
- New stakeholders appear late who weren't involved in earlier discovery, often introduced specifically to manage out a vendor the team has already decided against.
What this tells you about where the competitive evaluation actually happened: most of it occurred before or during mid-cycle engagement. By the time your deal reached the proposal stage, the buyer's preference was already formed. The proposal was a formality.
The forecast implication is real and it gets ignored constantly. Unweighted pipeline should run well above what you need. Weighted pipeline, adjusted for stage probability, should be tighter. Late-stage deals carrying inflated probability weights when they're already at competitive risk distort the entire forecast. If your pipeline hygiene isn't accounting for this, your forecast is telling you a story that isn't true.
The most direct source of insight here is post-loss conversations with buyers who dropped out at the proposal stage. They will often tell you about the competitive conversation your rep never saw. That is where formal win-loss programs pay back most directly.
How to Build the Intervention Cadence Once the Warning Signals Show Up
Seeing the signal is not the intervention. This is where most teams stop. They have a dashboard. They have a flag. And then nothing happens with it because there's no defined response. A signal without a plan is like a smoke detector with no sprinklers — it tells you the problem but does nothing to solve it.
A signal without an SLA, a routing decision, and a talk track is a signal that gets ignored.
Here's how to build the prioritization logic:
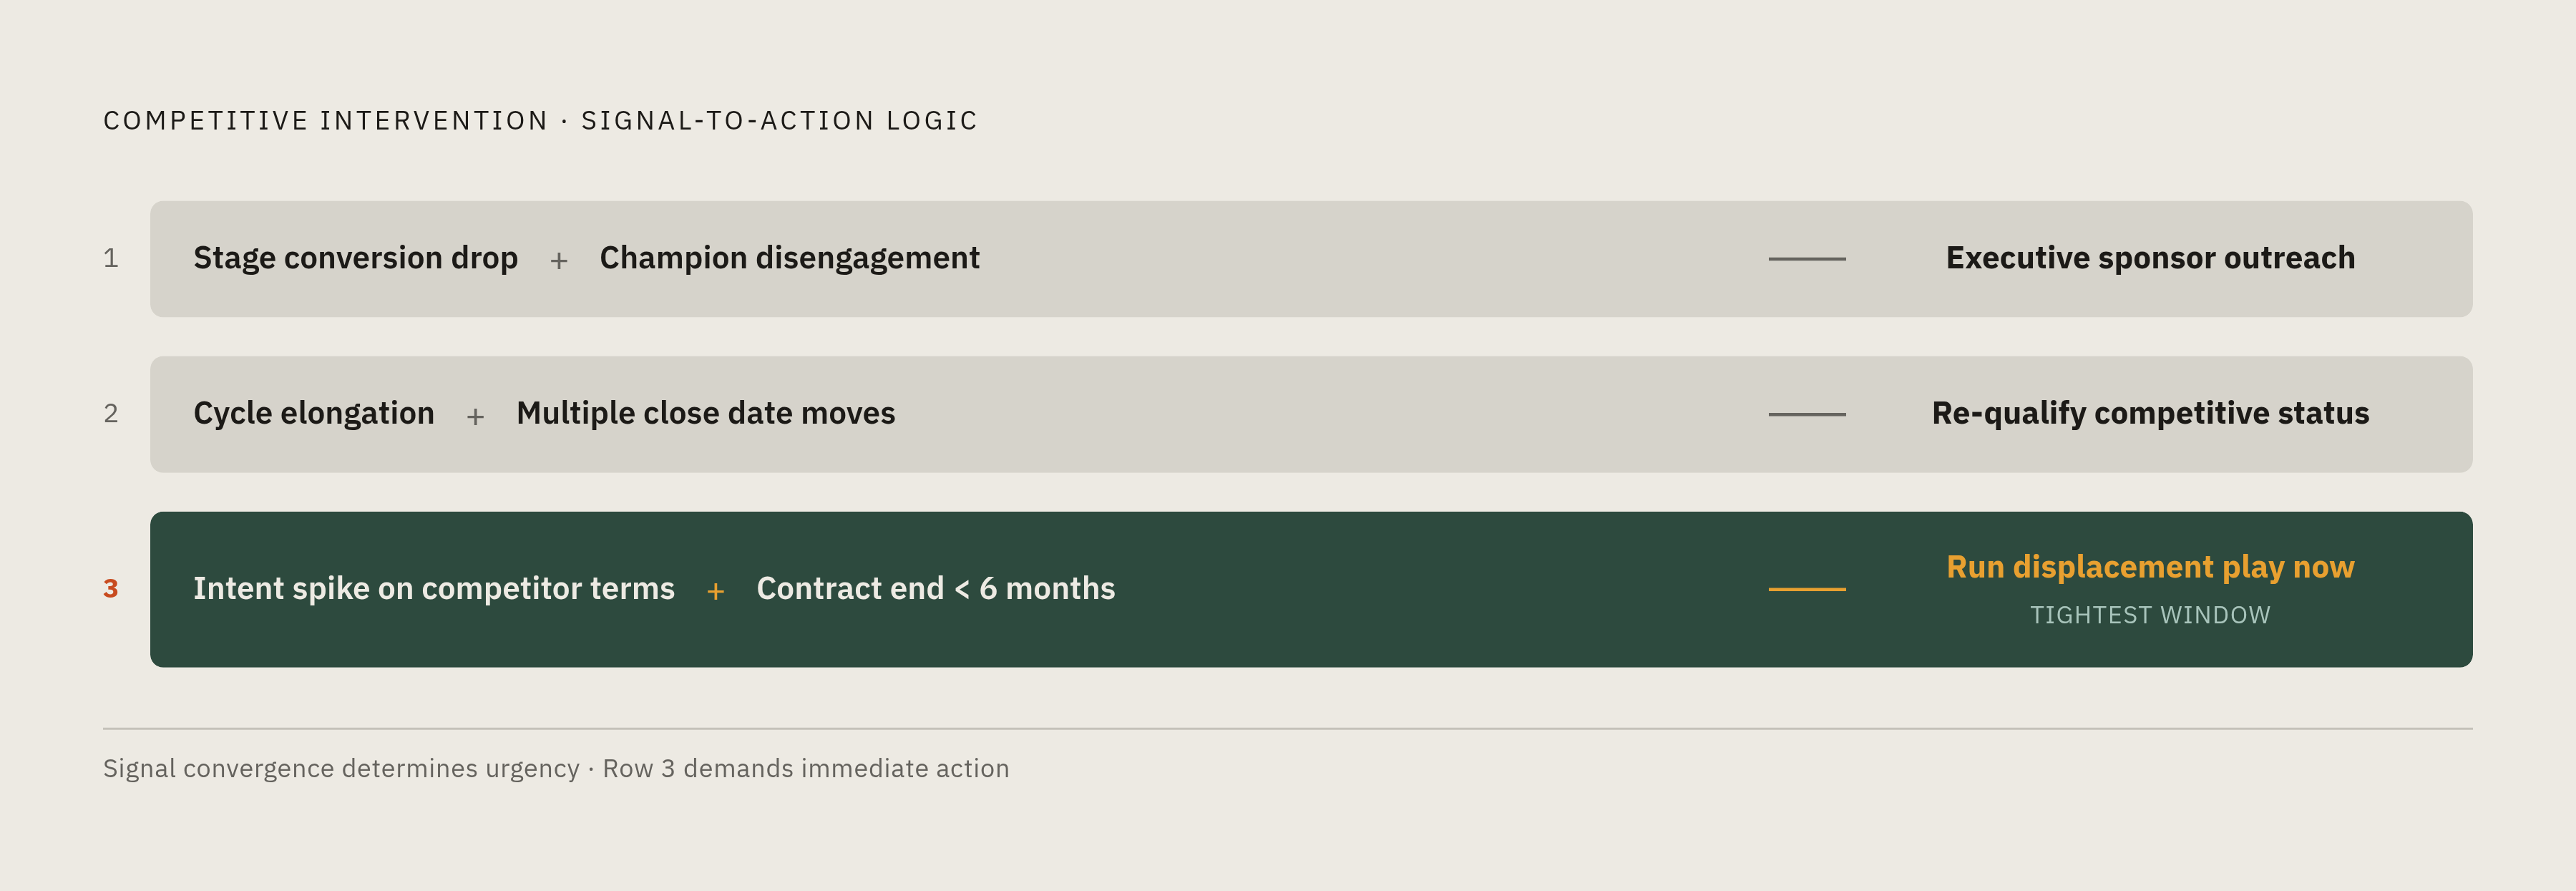
- Stage conversion drop + champion disengagement: Trigger an executive sponsor outreach. Not another email from the same rep.
- Cycle elongation + multiple close date moves: Re-qualify the deal's competitive status explicitly. Don't assume it's still non-competitive just because no one has said a competitor's name.
- Intent spike on competitor terms + contract end date within six months: Run a displacement play now. Not at renewal.
On battlecards: a serviceable competitive battlecard that gets refreshed monthly outperforms a polished one built once a year. Recency beats completeness when the competitive landscape is moving.
On timing: proactive outreach framed around an upcoming renewal lands eight months out. The same outreach one month before renewal usually arrives after the decision is made. This keeps coming up because it keeps being true.
On content as the intervention vehicle: buyers who are mid-evaluation are actively consuming content. The move that works is not a discount. It's a credibility signal. A relevant case study. A direct comparison piece. A piece of thinking that reframes how they're evaluating the category. Sellers who show up with insight instead of a pitch have a structural advantage in complex deals with long cycles and large buying committees.
The measurement close is straightforward: track whether the signal-triggered play actually changed outcomes. Competitive win rate segmented by whether an intervention was run is the metric that validates the whole system. If the plays aren't moving the number, the signals are right but something in the execution is off. Fix that and the whole thing compounds.