Customer Health Scoring Models for B2B SaaS
Weighting usage trends and support signals correctly matters far more than complexity.

A health score only earns its keep if it tells someone what to do next. Most B2B SaaS companies build scores that describe the past accurately and predict the future badly, then act shocked when the QBR turns into a surprise party nobody wanted. Picture the account: usage down 40% in Q3, two support tickets sitting open for weeks, the executive sponsor gone since August. Every one of those signals sat in a dashboard the whole time. Nobody connected them into a score that triggered action, so the churn happened before anyone got a calendar invite on the books.
A health score measures the present condition of an account, right now, today. Churn prediction estimates future risk. They overlap, but they are not the same tool, and treating them as interchangeable is how a lot of scoring models end up mushy and useless. Green does not mean safe, either. A customer logging in every single day can still be circling the drain: the executive buyer hates the tool, finance is disputing invoices, and the internal champion who fought for the renewal just quit. Daily logins measure habit, not happiness, and mistaking one for the other is how healthy-looking accounts vanish overnight.
What the financial stakes of retention look like in 2026
Retention math has gotten meaner. OpenView's 2026 SaaS Benchmarks put new customer acquisition at 5 to 7 times the cost of keeping an existing one, with CAC payback averaging 18 months. Bain & Company found that ratio stretches several times higher in long sales-cycle industries, where a lost enterprise account takes years to replace with new logos.
Retention has also turned into a valuation lever. KeyBanc Capital Markets' Annual SaaS Survey found companies with net revenue retention above 120% trade at 2 to 3 times higher revenue multiples than those under 100% NRR. Boards track that number now, right alongside ARR growth and burn rate, not buried three slides deep in a CS deck.
SaaS Capital's Benchmark Report puts median NRR at 102%, down from north of 110% in 2021 and 2022. That drop changes the math on every churned dollar: at compressed multiples, each point of churn costs more equity value than it did three years ago. Gainsight's 2024 CS Index shows median gross retention around 91%, with top-quartile companies clearing 95%. At enterprise scale, that four-point gap is tens of millions in ARR. Improving retention by a single point often adds more enterprise value than chasing double-digit new logo growth ever does. The health score belongs in the same category as pipeline coverage and win rate: it is a revenue instrument, not a customer success curiosity.
Which signals predict account condition, and which ones mislead
B2B health scoring is not user-level scoring wearing a company badge. One disengaged user tells you almost nothing on its own. Three inactive admins at the same account usually means something is wrong at the organizational level. The score has to answer whether the organization renews, not whether one employee had a rough week.
Five buckets of signal actually matter. Product usage covers login frequency, feature breadth, active seat counts, and depth of use inside core workflows: not just whether someone logged in, but whether they touched the thing that matters. Support signals cover ticket volume, escalation patterns, resolution time, and the tone of closed tickets. Commercial signals track payment history, contract value trends, renewal proximity, plan changes, and seat growth. Relationship signals watch executive sponsor engagement, whether the champion who bought the tool still works there, coverage across the buying committee, and QBR attendance. Sentiment rounds it out: NPS, CSAT, call notes, the tone of emails.
Four of those tend to carry the most predictive weight for most B2B SaaS businesses: engagement trend against baseline, activation milestone completion, billing cadence, and time-to-renewal. Sequence matters as much as the signal itself. A drop of 30% or more in monthly login frequency or feature engagement is usually the first flare, appearing 30-plus days ahead of cancellation in most churned accounts. Feature usage contraction tends to follow two to four weeks before cancellation, a pattern that signals the account is deep into a disengagement cycle. Support ticket sentiment shifts two to three weeks out correlate strongly with churn inside the next 30 days.
Telemetry tells you what happened. It never tells you why, and why is where churn actually starts: the champion left, the sponsor lost an internal budget fight, or the product solved a problem that quietly stopped existing. Qualitative signals from calls, emails, and support tickets can lead usage drops by 30 to 90 days, which trips up teams that build scores off telemetry alone. Chasing comprehensiveness kills a lot of these models before they ship. A 40-metric scorecard that nobody on the CS team can explain in a sentence is not rigorous, it is noise wearing a lab coat. Seven sharp, opinionated metrics beat forty vague ones, every single time.
Weighting signals and structuring the score to reflect your business
Copying a competitor's scoring formula off a blog post (present company excluded) is one of the fastest ways to build a score that is confidently wrong. The right model reflects a specific product, a specific contract structure, and specific customer behavior. A startup selling annual contracts with multi-user seats needs a completely different weighting than a consumer app running weekly subscriptions, and pretending otherwise is how templates fail.
A reasonable starting point: give core product usage the heaviest single weight, around 40% for a typical SaaS model. Support interactions come in lighter, closer to 15%. The rest splits across commercial, relationship, and sentiment signals, and that split should come from what a company's own churn history shows was predictive.
Three bands tend to cover most B2B SaaS scoring needs. Zero to 40 is critical risk, meaning immediate intervention. 41 to 70 is the monitoring zone, where proactive engagement heads off a slide before it turns into a crisis. 71 to 100 is stable, meaning renewal is likely and there may be room to talk expansion. Calibrate those thresholds against actual churn history. A generic number pulled from a vendor's marketing page is a guess wearing a suit.
Segmenting by lifecycle stage changes how healthy accounts get identified and scored. An account three months into onboarding and an account three years into the relationship are healthy for completely different reasons, and scoring both on the same scorecard flattens signal that should stay separate. The stronger platforms let a team build multiple scorecards by segment and shift the weighting as accounts move through the journey. Pick a single primary use case for the score early. Hold that line. A model trying to predict churn risk and expansion opportunity at the same time tends to do both half-decently and neither well. For most product-led and customer-success-driven teams, churn risk is the primary job. Expansion prioritization is a downstream decision, and it deserves its own scorecard.
Rule-based scoring versus AI/ML models
Rule-based scoring wins early, and not just because it's simpler. CS operations can adjust weights and thresholds themselves, without waiting on an engineering sprint. If week-one teammate invitations turn out to correlate with 80% better retention, that weight gets bumped the same afternoon someone spots the pattern. Machine learning needs a volume of historical churn data most seed-stage and early-growth teams have not accumulated yet. Rules are also auditable: a CSM can look a customer in the eye, or on a video call, and explain why an account got flagged. That builds internal trust in the system before it ever gets tested externally.
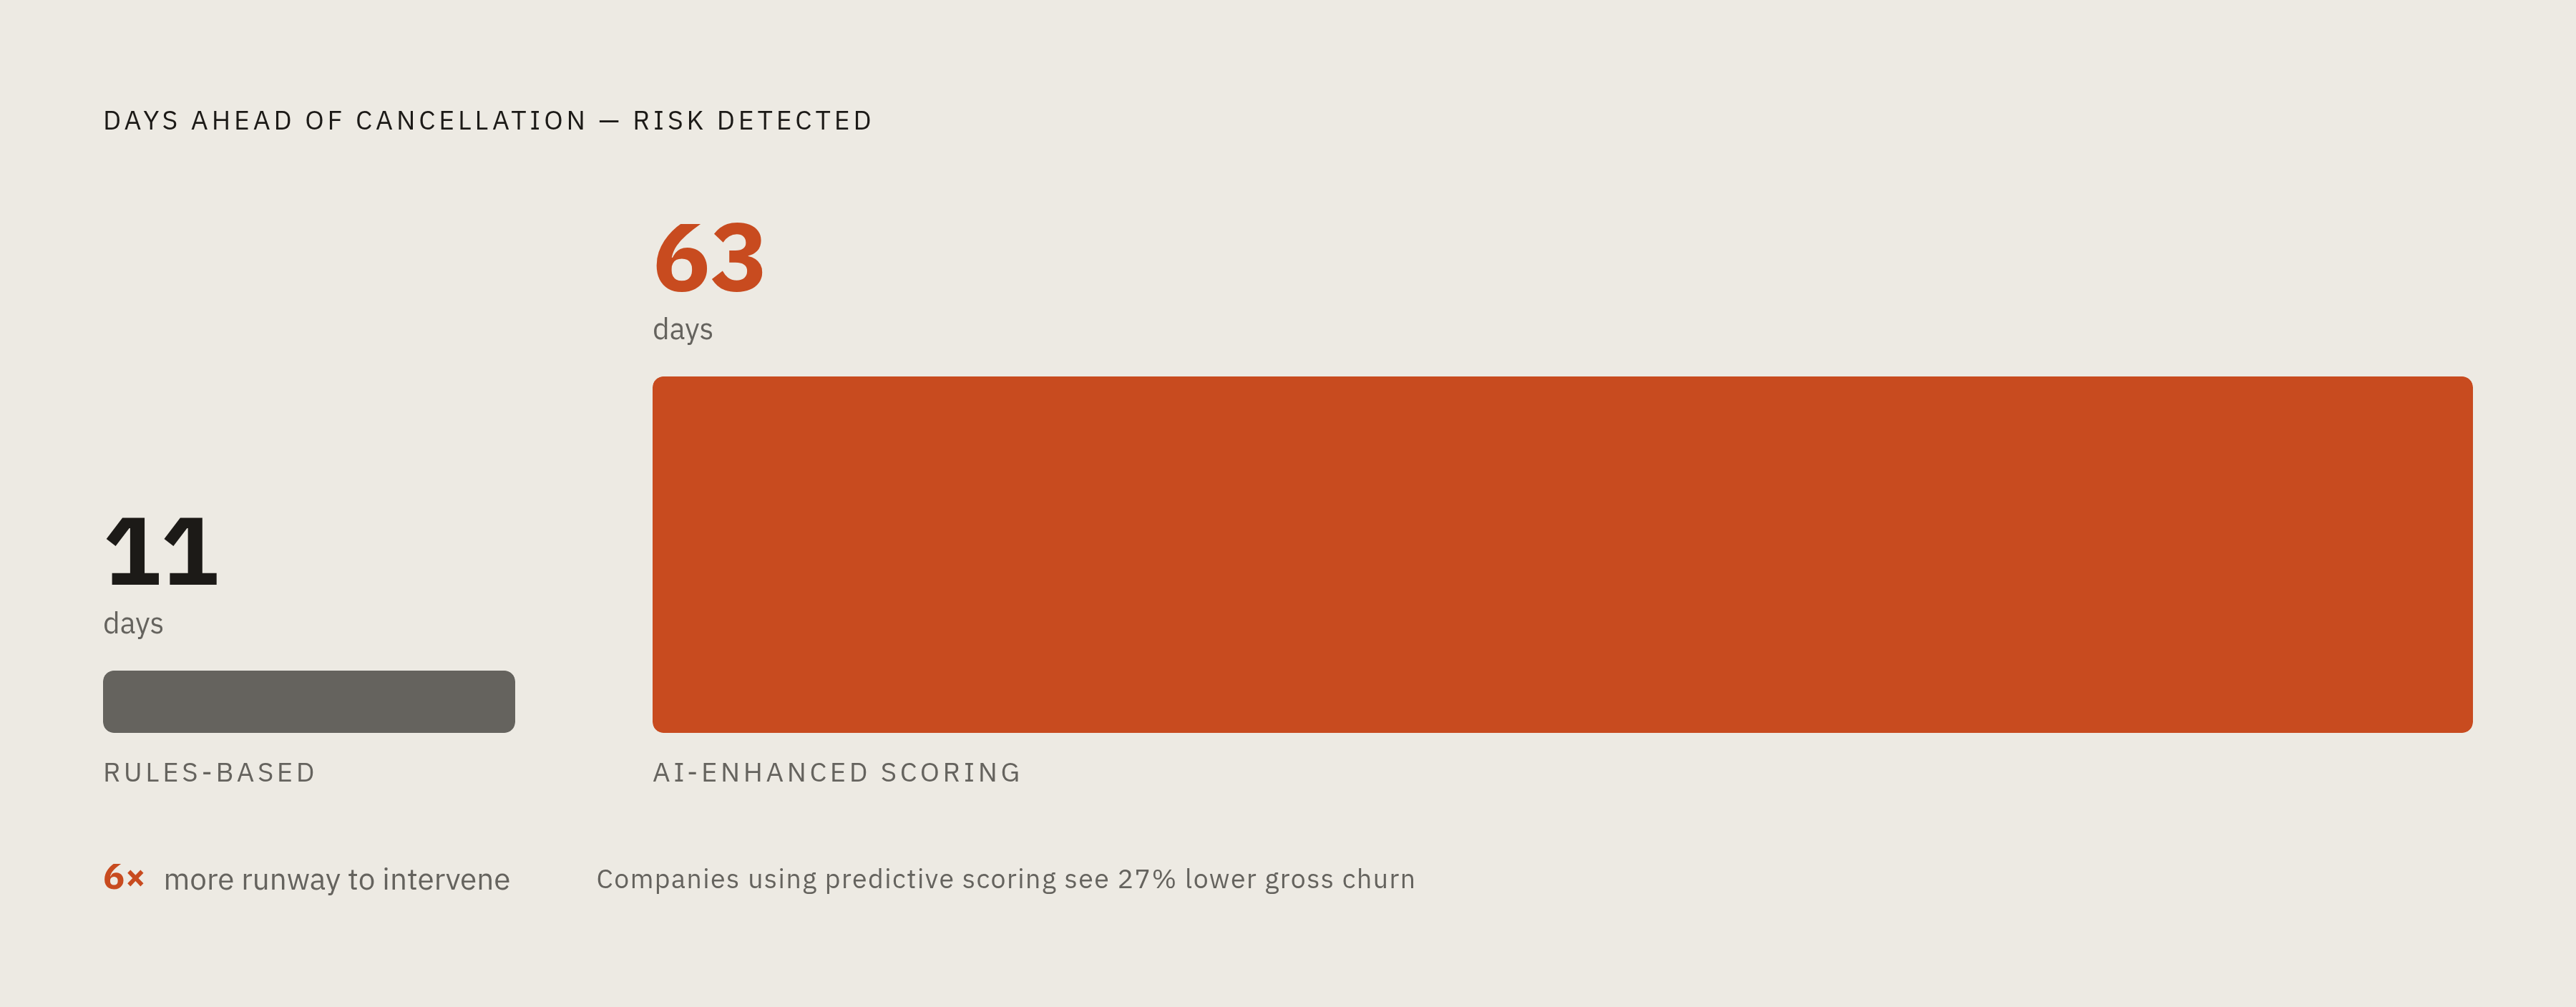
AI earns its keep once there is enough data behind it. AI-based scoring layered on top of raw telemetry has been shown to deliver 2 to 4 times better precision predicting 90-day churn. AI-enhanced scores have been shown to catch risk 63 days ahead of cancellation, versus 11 days for manual review, roughly six times the runway to actually intervene. Some AI-enhanced models predict churn 3 to 6 months out with accuracy above 85%. Gainsight's Pulse 2025 State of CS Report found companies running predictive health scoring see 27% lower gross churn than those relying on rules alone. That gap is the whole argument for making the switch once the data supports it.
The architecture most advanced teams lean on in 2026 is ensemble methods: gradient boosting and similar techniques that combine multiple model outputs instead of scoring each signal in isolation. That means multi-signal data scored together, not seven separate models fighting for attention on seven separate charts. Adoption has moved fast. Industry research found the share of CS teams using AI or machine learning for health scoring has climbed from about a third in 2022 to roughly double that now. And yet 74% of SaaS companies still lean on manual or semi-manual assessment day to day. That gap between stated adoption and what is actually running in production is exactly where competitive advantage sits right now.
The practical rule holds regardless of company size: fewer than two years of account-level churn data means starting rule-based, and logging everything along the way so a training set is ready when the time comes. Once the data is in hand, the case for AI is well documented, with surveys from G2 and TrustRadius putting protected revenue at several times over every dollar spent on churn-prediction AI.
Mapping every score band to a specific playbook so the number becomes a decision
A health score that does not change what a CSM or account executive does the next morning is a reporting artifact, nothing more. The gap between insight and action needs to close in minutes, well before a dashboard alert turns into an actual phone call.
Each band needs its own playbook, a specific set of actions rather than a vague "monitor closely" note sitting in a CRM field nobody checks. Critical accounts, scoring 0 to 40, need an immediate escalation path made up of an executive sponsor call, a dedicated save playbook, and an internal war room if the ARR at stake clears a set threshold. That call is not left to individual CSM judgment, case by case. Monitoring accounts, 41 to 70, get structured proactive engagement made up of a tighter check-in cadence, an agenda targeting specific activation gaps or support friction, and a flag for renewal forecast review so finance is not caught flat-footed later. Stable accounts, 71 to 100, get a lighter touch plus an expansion trigger, surfaced to sales or CS the moment feature adoption and seat engagement both trend up together.
Direction matters as much as the number itself. An account at 65 and climbing is a completely different conversation from an account at 65 and sliding, even though the raw score is identical. Alerts built only around threshold breaches miss that distinction entirely, so the trend line deserves its own alert logic, separate from the static number.
CRM integration quality decides whether any of this actually closes the loop. Scores should sync both directions so a rep sees health data without switching tools, and the reasoning behind a score change should land directly in CRM notes rather than sitting orphaned in a separate dashboard nobody opens on a Tuesday.
Intent data adds another layer to build into the playbook. An account sitting in the monitoring or critical band while also showing competitor comparison activity is the highest-urgency case on the board: a buyer actively shopping while usage is already declining, mid-cycle and genuinely at risk of walking. Sales and CS need one coordinated message here, not two separate emails landing in the same inbox on the same day saying different things. Defining the sales-to-CS handoff ahead of time avoids that collision. A healthy account renewing on schedule is a CS motion, full stop. A declining account crossing a key ARR threshold with real expansion potential attached is a joint play from day one.
Which platforms support score-to-action execution in practice
Picking the right platform comes down to team size, data pipeline maturity, and the primary job: stopping churn, driving expansion, or both. Pricing and implementation timelines are real constraints, not fine print to skim past.
At the enterprise tier, Gainsight CS is the deepest option for lifecycle orchestration, with the most mature scorecard engine on the market and scorecards, playbooks, and renewal forecasting built to run at scale. It fits CS orgs running 10 or more CSMs against enterprise accounts, with pricing and implementation timelines that reflect enterprise-scale deployment. It carries strong user ratings on G2. Totango, after acquiring Catalyst in 2024, now offers a combined workspace pulling from both products. It leans strong on health-plus-expansion signals, offers no free tier, and starts with a sales demo and custom quote rather than published pricing.
The mid-market tier has more range. Vitally ranks well for teams with mature CS operations, pairing flexible scoring with deep workflow automation, quote-based pricing, and a 4.5 G2 rating. ChurnZero runs on a play-and-alert model, where a score automatically fires the next best action instead of waiting for a human to notice the dashboard changed, built specifically for mid-market SaaS. Pricing ranges from $10,000 to $180,000-plus a year, though most mid-market buyers are between $15,000 and $40,000 annually, and its ChurnScore composite model is a notable feature. Planhat leans into flexible data modeling, built for teams pulling health signal from a lot of different sources at once. Custify takes a dashboard-first approach, centralizing account health visibility around a Customer 360 view, and fits early and growth-stage teams running small CS teams of 2 to 10 CSMs. Pricing starts around $500 to $1,500 a month, and G2 rates it 4.7 out of 5.
Down at the startup and SMB tier, Akita fits small business adoption with a 14-day free trial and pricing from $49 a month. Pylon targets early-stage churn detection starting at $59 per seat, billed annually. Customerscore.io runs AI-driven churn risk and upsell scoring with pricing starting around 119 euros a month, scaled by custom quote against ARR tier. ClientSuccess focuses on renewal forecasting, and Kapta is built for key account management teams. Both list pricing upon request.
None of these tools build the score for a company. They execute against one that has already been thought through: the right signals, weighted against a company's own churn history, mapped to a playbook that tells someone what to do the moment the number moves. Get that part wrong, and the fanciest platform on this list turns into a more expensive dashboard nobody checks until the QBR nobody wanted.