Early Warning Signals That Predict B2B Customer Churn
Watch for silent customers and departed champions weeks before renewal conversations collapse.

B2B churn rarely blindsides the customer. It blindsides the vendor. By the time a renewal conversation goes sideways, the customer has usually made up their mind weeks, sometimes months, earlier. This piece maps the signals that appear before that decision gets made, and what to actually do once you spot them.
Here's the scene that plays out at a depressing number of companies: a CSM calls 30 days before renewal, the customer takes two days to even respond, and when they finally do, it turns out legal is already reviewing the contract and a competitor demo happened last week. Nobody panicked overnight. The champion who used to answer in an hour went quiet. Usage dropped and nobody looked. Support tickets piled up and got answered late, or not answered with any urgency. The churn was written in the data the whole time. Nobody read it.
The dollar math makes the stakes obvious. B2B SaaS averaged around 12.5% annual churn, according to getmaxiq.com. Run that against a $30M ARR business and you're losing $3.75M a year, before anyone even talks about downgrades or contraction. That's why net revenue retention climbed out of the customer success team's dashboard and onto the board deck. Industry analysis found top-quartile B2B SaaS companies hit roughly 113% NRR, growing revenue from existing customers without adding a single new logo. That kind of number doesn't happen by reacting fast. It happens by reading slow, quiet signals early enough to do something about them.
The first signal most teams miss: what stakeholder change means for a renewal
Champion departure might be the single most underrated warning sign in enterprise software, according to getmaxiq.com research. It's easy to miss because it doesn't look like a crisis. It looks like an org chart update.
When your champion leaves, the person who replaces them didn't choose your product. They inherited it. They have no memory of the original business case, no emotional buy-in, and usually no relationship with your CSM at all. It's the software equivalent of moving into a house someone else decorated. You don't feel attached to the wallpaper, you just want to know if you can paint over it.
The lead time on this signal typically runs 30 to 60 days before churn actually happens, per getmaxiq.com. Most teams don't catch it until the renewal call itself, which is roughly the same as checking the weather forecast after you've already gotten soaked. The fix isn't complicated: trigger a relationship mapping exercise the moment a primary contact changes title or goes quiet on LinkedIn. Job change alerts, bounced emails, a sudden drop in calendar engagement, these are all detectable. They just require someone whose job is to actually watch for them.
Stakeholder turnover is one flavor of relational decay. A deeper pattern of relational decay produces these individual signals and often shows up even earlier.
How silence, not complaints, signals a relationship in decline
Complaints feel like the danger sign. They're not. A study in the Journal of Service Research, analyzing more than 840,000 customer interactions, found that communication cessation, not complaint volume, predicts defection more reliably across both B2B and B2C relationships.
Think about what that means practically. A contact who used to reply within hours starts taking days. Responses get shorter, more clipped. Check-in calls get skipped, or when they do happen, everyone's clearly checking their phone under the table. None of that is a complaint. It's worse: it's indifference. It's indifference.
AI-driven sentiment analysis of emails, calls, and support tickets can detect this kind of relationship decay up to six weeks earlier than product usage data alone, according to getmaxiq.com's 2026 findings. Most teams wait for a complaint or an escalation before they act, but those are late-stage signals, arriving after the customer has already mentally exited the relationship. Silence appeared first.
QBR attendance is a good, boring, underrated tell. A customer who skips or declines quarterly business reviews two quarters running is telling you something, just not with words. They're telling you with their calendar.
What product usage data can and cannot tell you about churn risk
Usage data gets tracked more than any other signal, which makes sense, since it's the easiest to instrument. It's not always the earliest signal, though, and it's rarely the whole story.
Login frequency is the blunt instrument here. Research from Imperva found a 40% drop in weekly logins predicts churn with 78% accuracy, but the trend is a more reliable signal than any single number on any single day. An account-level mistake trips up a lot of teams: they watch individual user logins and miss that the team, collectively, has quietly checked out. One founder cited in industry research found the single biggest churn reason wasn't price or features. It was "we couldn't get our team to use it," a problem invisible to any dashboard tracking one login at a time.
Feature adoption goes deeper. Accounts with adoption below 30% show an 80% correlation with first-year churn, per buildmvpfast.com data. Slack offers a useful anchor point here: Stewart Butterfield identified 2,000 messages sent as the threshold where teams started experiencing real value from the product, and Slack has maintained a 98% retention rate among paying customers. That's not a coincidence, that's a company that found its own magic number and built retention strategy around it. Amplitude's research backs up the broader pattern: a 69% correlation between strong seven-day activation and strong three-month retention. Whatever happens in the first week tends to echo through the whole relationship.
Root causes matter as much as symptoms. Per getmaxiq.com, 53% of enterprise SaaS churn traces back to three things: bad onboarding, weak relationship management, and reactive customer service. All three leave fingerprints in product and support data well before renewal ever comes up.
Here's the limit, though. A login dashboard that's flashing red is already a lagging indicator at the account level. By the time it turns red, a competitor's pricing sheet has probably already made the rounds internally. Usage data catches decay in the middle innings. Something earlier, and more human, appears in support tickets.
What support ticket patterns reveal that usage dashboards do not
Context is everything with support data. A brand-new customer filing five tickets in their first week is enthusiasm. An established customer who files zero tickets for four months and then suddenly files six in a week is telling a completely different story. The shift itself is the signal, not the ticket count.
A few patterns stand out.
- Frequency spikes from accounts that had gone quiet
- Escalation trajectory, where language moves from "how do I do this" to "this is broken" to "we need to talk about the contract"
- Mid-thread disengagement, where a customer stops responding to support replies altogether
- Sentiment shift, with words like "frustrated," "alternative," or "considering" showing up in ticket text
Support teams often hear the unfiltered version of the truth before anyone else does, long before a QBR ever goes sideways. The catch is that most of these signals sit trapped in ticket queues with no system built to surface or route them anywhere useful. Support data and customer success data typically live in separate systems entirely, which means the loudest early warning in the company sometimes never reaches the person who owns the account.
Support tickets are just one flavor of unstructured language sitting around, unread. Calls, NPS comments, QBR notes carry the same kind of signal, and reading them systematically is where prediction accuracy is heading next.
Why what customers say matters as much as what they do
A single sentence can be worth more than a month of usage data. When a CSM hears "we're evaluating options" on a call, that customer becomes 4 to 6 times more likely to churn within 90 days, according to buildbetter.ai. That's a signal no behavioral model, however sophisticated, will ever catch, because it never appears as a number anywhere.
Sales calls, support tickets, NPS verbatims, email threads, QBR notes: all of this is unstructured, and until recently, most of it was effectively unsearchable at scale. Nobody had time to read every transcript looking for the word "competitor." Language-model-based analysis changes that math. It can track sentiment drift across an email thread over months, flag competitor names mentioned on a call, or surface a feature request that's come up in three separate conversations without anyone connecting the dots.
The emotional side of this isn't a footnote either. PwC's 2025 Customer Experience Survey found 52% of consumers stopped using a brand after one bad product experience, and 29% walked away over a poor customer experience, online or in person. Experience runs on its own timeline, separate from anything a usage chart will show you.
NPS verbatims and QBR notes might be the most honest thing a customer ever tells you, and they're also the least systematically read data category in most CS organizations. That's not a small gap. That's a filing cabinet full of warnings nobody opened.
The competitive intent signal hiding inside current accounts
Some of the clearest churn signals don't come from inside your own product at all. When a current customer starts researching competitors or revisiting pain-point content, that behavior appears in third-party intent data well before the customer says a word to anyone on your team.
Buying groups typically rank their preferred vendors before ever picking up the phone to talk to sales, so by the time a customer casually asks for a "competitive comparison," the internal shift has already happened. Buying groups typically rank their preferred vendors before ever picking up the phone to talk to sales, which means by the time a customer casually asks for a "competitive comparison," the internal shortlist is often already locked. Competitor research inside an existing account isn't a renewal negotiation tactic. It's a mid-cycle churn signal, and it calls for immediate coordination between sales and CS, not a slot on next quarter's QBR calendar.
A customer reading "alternatives to [your product]" content looks behaviorally identical to a brand-new prospect shopping around. The only difference is you already have a relationship to save. Revenue teams that track intent signals across their installed base, not just their prospect list, get an early view into which accounts are drifting toward a competitive bake-off. A well-timed, informed outreach at that point, backed by the right content and a clear-eyed competitive pitch, beats a panicked save call after the decision's basically made.
None of this matters, though, if the signal arrives too late to act on. Timing is the whole game.
How detection timing determines whether intervention is possible at all
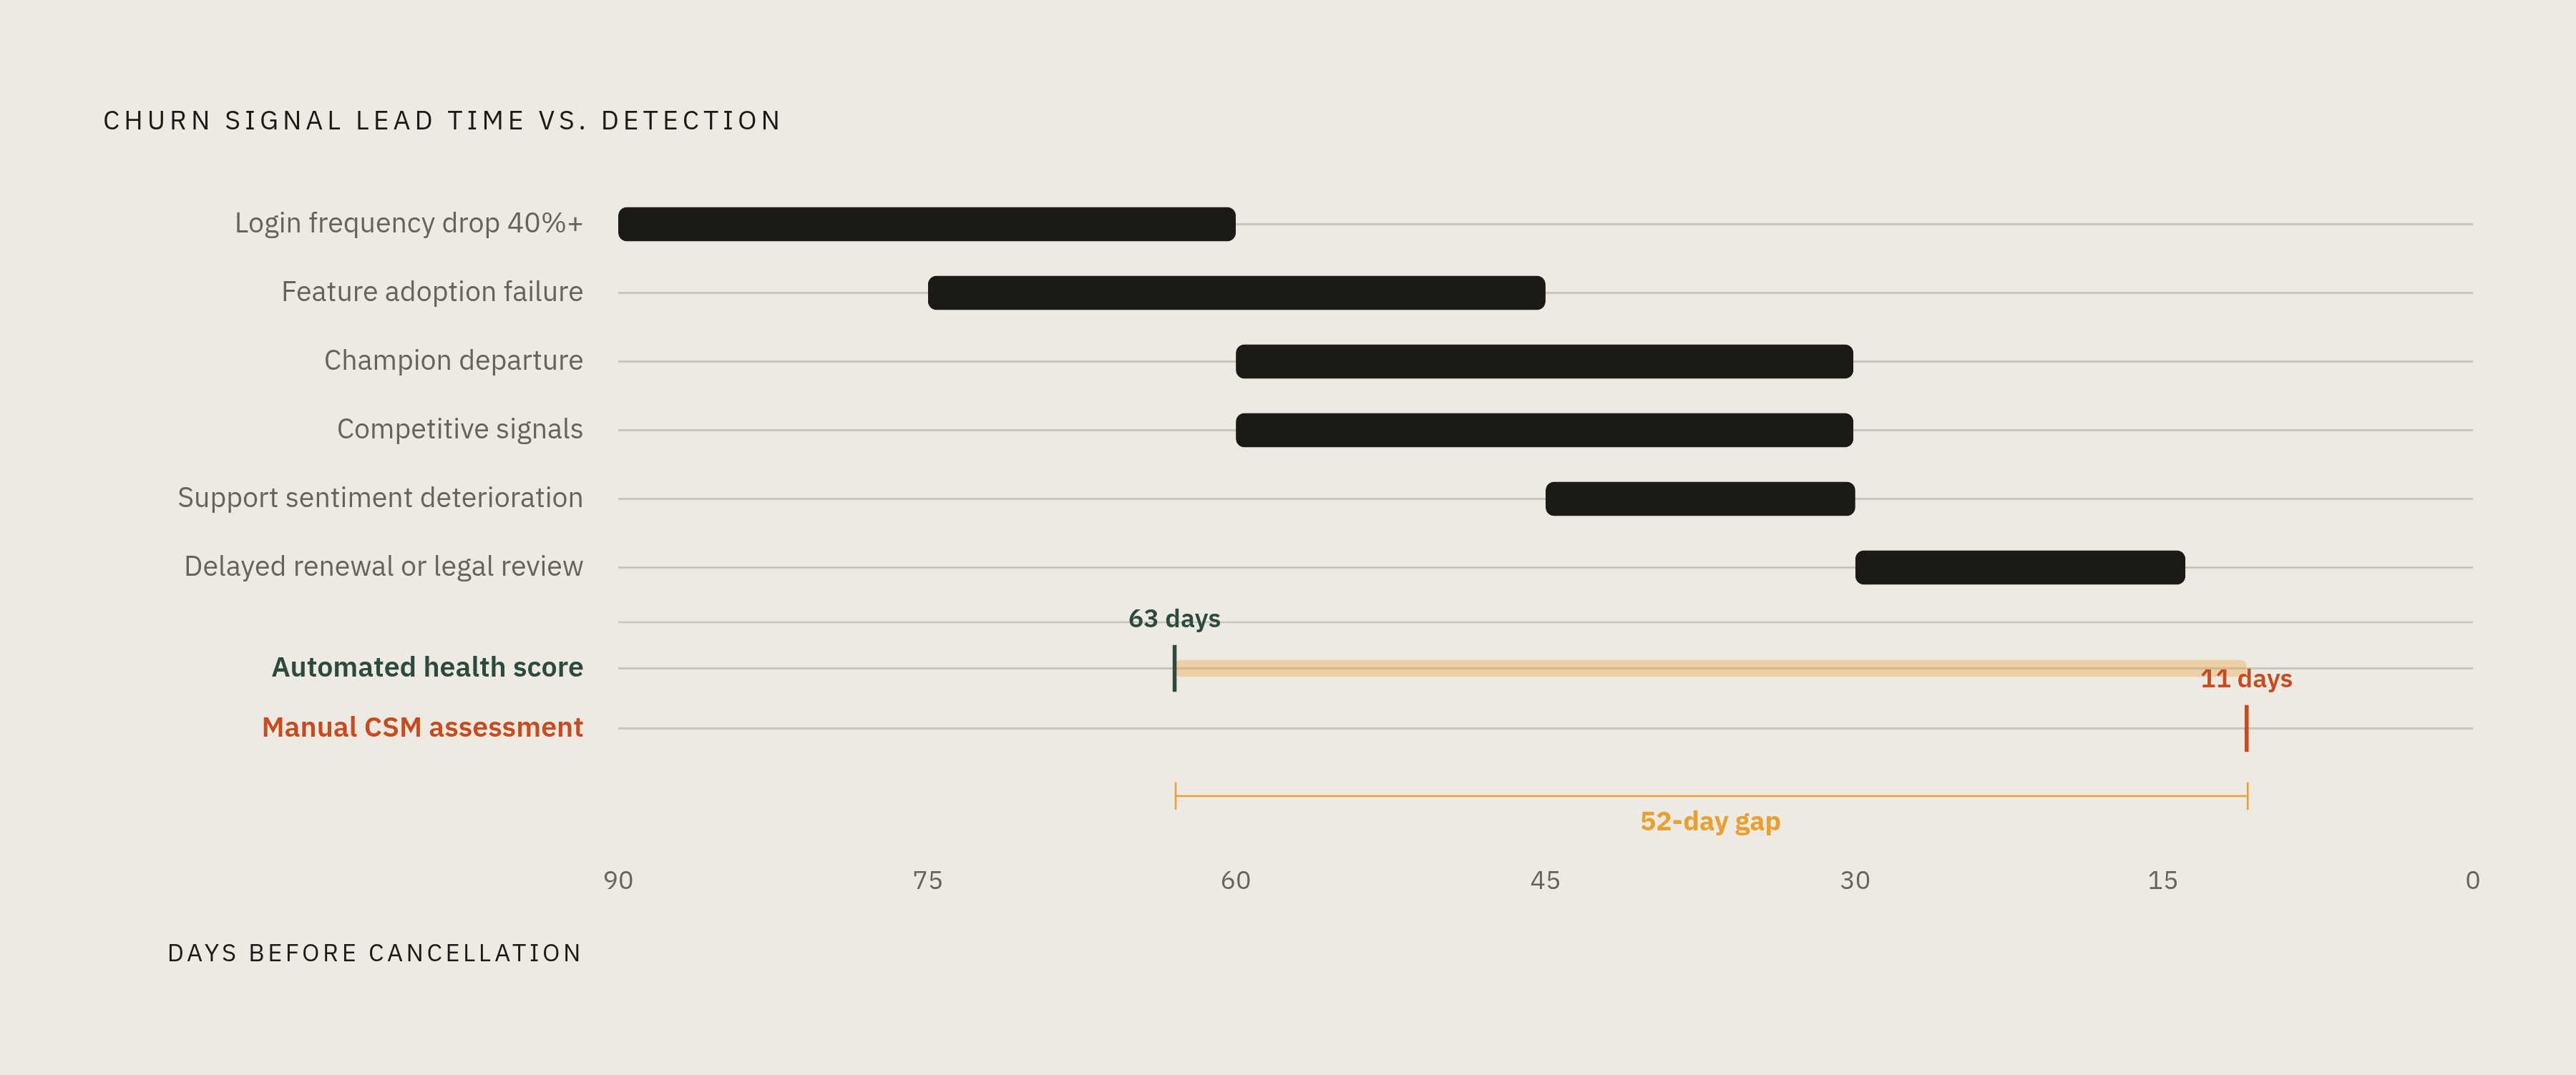
Industry benchmarking has put a number on the gap that decides everything: automated health scores detect churn risk an average of 63 days before cancellation. Manual CSM assessment catches it an average of 11 days out. That's a 52-day difference, and it's the difference between a real save and a last-ditch attempt.
Eleven days buys you a phone call, maybe a discount if you're desperate. It doesn't buy time for executive escalation, custom contract terms, or a product roadmap conversation that actually addresses why the customer's unhappy. Sixty-three days buys all of that. Executive alignment, a real value re-anchoring conversation, even a competitive displacement play if things have gone that far.
Scoring cadence compounds this. Real-time scoring opens up intervention windows of 30 to 90 days before cancellation. Batch scoring, run weekly or monthly, shrinks that same window down to 7 to 14 days, per buildbetter.ai analysis, often too tight for the kind of multi-stakeholder save that B2B deals require. The onboarding period deserves special attention: aggregated subscription data found 44% of all cancellations happen within the first 90 days. The month-three cliff appears across categories, which makes early onboarding signals the single highest-priority window to watch.
Lead times vary quite a bit by signal type, according to getmaxiq.com data:
- Login frequency drop of 40%+: 60 to 90 days
- Feature adoption failure: 45 to 75 days
- Champion departure: 30 to 60 days
- Support sentiment deterioration: 30 to 45 days
- Competitive signals in calls or tickets: 30 to 60 days
- Delayed renewal talks or early legal review: 14 to 30 days
Here's the irony. The signal that arrives last, contract behavior and renewal delays, is the one most teams treat as the alarm bell. Meanwhile the signals that appear first, quiet inboxes, stalled feature adoption, a champion who just left, sit there unwatched the entire time.
Why most churn prediction deployments fail to prevent churn
Plenty of companies build a churn model, get leadership sign-off, and ship a dashboard. Predicting churn becomes a quarterly ritual. And the churn keeps happening anyway, according to rethinkcx.com's analysis of these deployments. The model was never the problem. Nobody built anything to happen after the model spoke.
Save rates in these failed setups are negligible, because flagging a risky account means nothing if no one's job is to respond to the flag. Compare that to deployments where the action layer actually got built out: save rates are between 30 and 45%, per rethinkcx.com.
What does an "action layer" actually look like? A few concrete pieces:
- Routing rules that say exactly which signal level triggers which person, at what seniority
- Separate playbooks for separate signal types (a champion departure needs a different play than a feature adoption failure)
- A clear protocol for who calls who when a large account lights up red
- Content already built and ready to send: competitive battlecards, ROI materials, re-engagement sequences for onboarding
A churn model is only as good as the playbook sitting behind it, Gainsight CEO Nick Mehta said, per buildbetter.ai. Prediction without action is just an expensive way of watching customers leave in slow motion.
The financial case for closing that gap is straightforward. Surveys from G2 and TrustRadius show companies see several times their spend in protected revenue for every $1 spent on churn prediction tools. And the arithmetic scales cleanly: every single percentage point of churn reduction is worth $300K in retained ARR for a $30M ARR business, according to getmaxiq.com, revenue that never has to be replaced by a sales team hunting for new logos.
Building a signal-to-action workflow your revenue team will use
None of this is about building a smarter model. It's about shortening the distance between a signal firing and a human being talking to the customer about it.
A model that predicts churn with impressive accuracy but sits in a dashboard nobody checks is functionally the same as no model at all. The real work is routing: deciding in advance which signal (a quiet champion, a support ticket sentiment shift, a competitor mention on a call) goes to which person, on which day, with which playbook already loaded and ready to go. Detection without a designated human on the other end is just a very expensive way of confirming what already happened.
Get the routing right, and the rest of this article stops being theory. Champion departure triggers a relationship-mapping check within days, not at renewal. A QBR decline triggers a CSM call, not a shrug. A competitor mention on a support call triggers a coordinated sales and CS response inside the week, not a note in a CRM field nobody reads. The signals were always there. The only question that ever mattered was whether anyone built a system fast enough to catch them while there was still time to do something about it.
Sources
- Customer Churn Prediction for B2B SaaS (2026 Guide + Models)
- Leading Indicators of Churn for B2B SaaS 2026
- 10 Best Customer Churn Prediction Software Options in 2026
- Predictive Sentiment Analytics: How to Predict Customer Churn Before It Happens (2026 Guide) | Eclincher
- AI churn prediction in 2026: predict and resolve | DevRev
- blog.buildbetter.ai